Intro
Skip reading and jump to the result here – it takes time to load (like all of the good things).
Have you ever wondered how Stack Overflow tags are connected? How would that network look like? Below we have a question with 4 tags: python, module, installation, python-wheel.

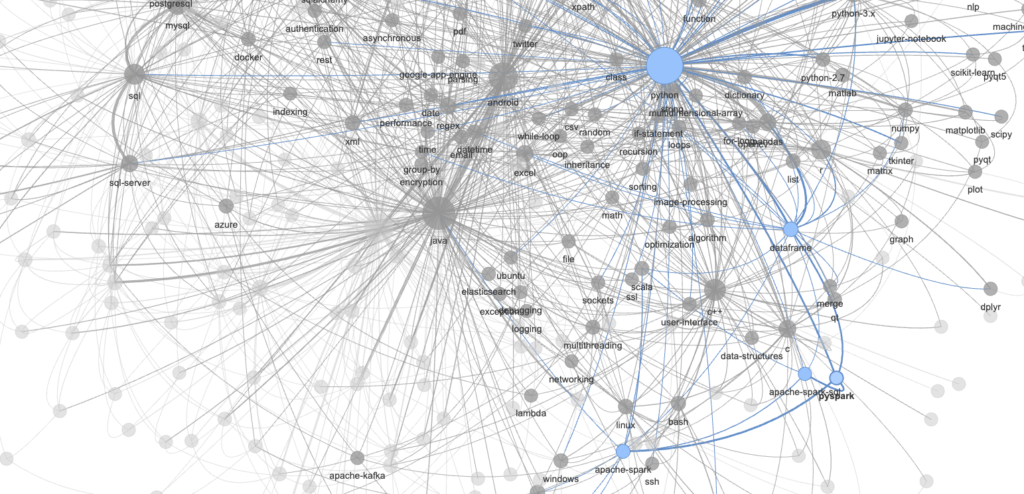
What if we scanned all of Stack Overflow, combining ALL tags from ALL questions to create a map? Let’s have a look.
Example
Let’s look at an example of a small network graph.
Assumptions:
- We only have a few questions and only 3 tags:
python,pysparkandhive. - We have specifically:
- 10 questions with tag:
python - 5 questions with tags:
pythonandpyspark - 1 questions with tags:
python,pysparkandhive
- 10 questions with tag:
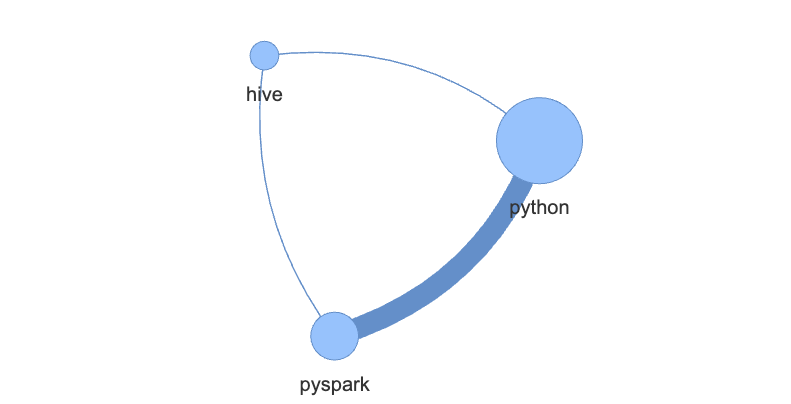
If we apply graph theory to our example, we can identify a few key entities:
- 3 “nodes” – tags
python,pysparkandhive:python– node size 16 – occurs in 10 + 5 + 1 questionspyspark– node size 6 – occurs in 5 + 1 questionshive– node size 1 – occurs only in 1 question
- 3 “edges” – relationships between nodes:
python–pyspark– relation strength 6 – ocurst together in 5 + 1 questionspyspark–hive– relation strength 1 – occurs together in only 1 questionpython–hive– relation strength 1 – occurs together only in 1 question
Coding our example
Python’s NetworkX is the most known pythonic library for complex network analysis – yet I have chosen Pyvis for fantastic interactive visualizations.
import pandas as pd
from pyvis.network import Network


data = {
    'tags_delimited': ["python", "python,pyspark", "python,pyspark,hive"],
    'cnt': [10, 5, 1]
    }

df_ = pd.DataFrame(data)
df_
Gives us:
>>> tags_delimited	      cnt
>>> 0	python	            10
>>> 1	python,pyspark	    5
>>> 2	python,pyspark,hive	1
Let’s draw a simple network:
nt = Network(notebook=True, cdn_resources='in_line', height="800", select_menu=True)
nt.repulsion()

nt.add_node("python", value=16)
nt.add_node("pyspark", value=6)
nt.add_node("hive", value=1)

nt.add_edge(*("python", "pyspark"), value=6)
nt.add_edge(*("pyspark", "hive"), value=1)
nt.add_edge(*("python", "hive"), value=1)

nt.show("test.html");
Voilà! Once we open test.html, we can see the result. The sizes of nodes and thicknesses of edges are clearly displayed.

Let’s scale it to the whole Stack Overflow, shall we?
Step 1 – getting the data
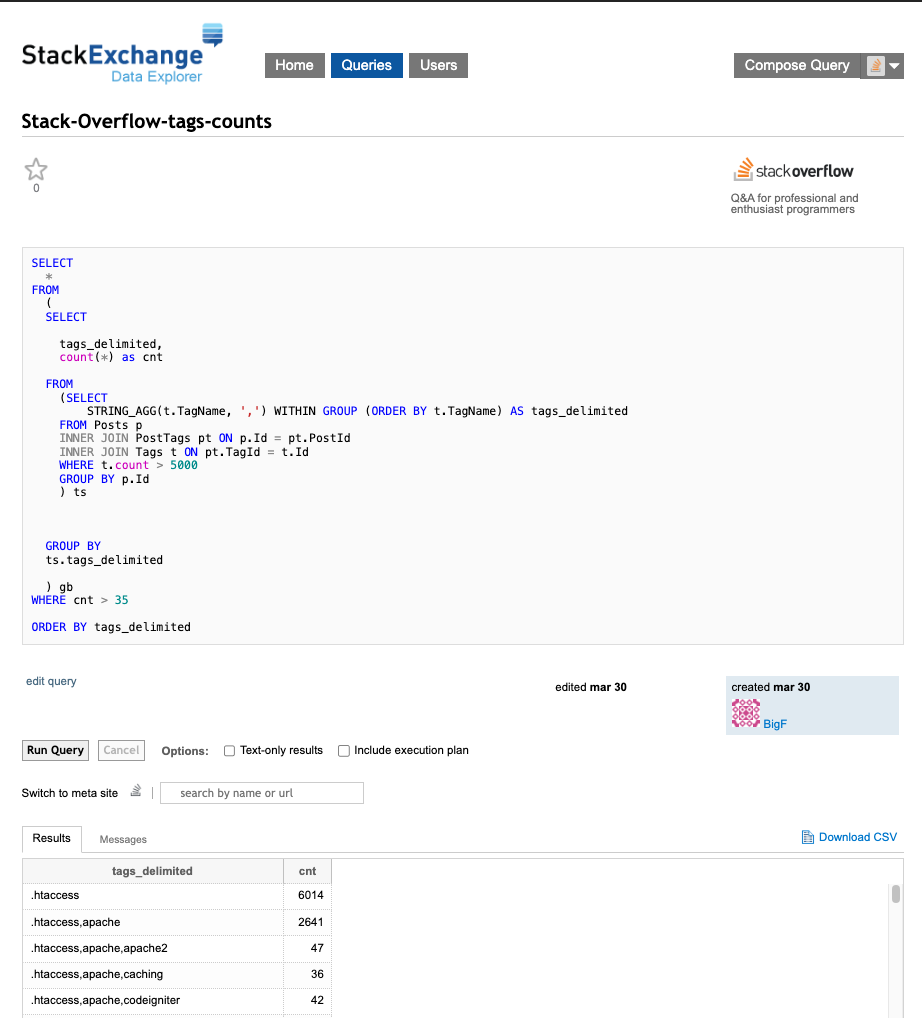
Do we need to crawl the entire Stack Overflow or use the API question by question? Fortunately, no (even though the site offers a great API). We can directly utilize the data from the forum!
I have created a query here – please note that there is a high number of tags, so I had to limit them to the most popular ones. This was necessary because the saveable data was capped at 50k rows.

Step 2 – processing the data
This section demonstrates how I converted the pandas dataframe into nodes and edges – feel free to skip this section unless you like for-loops a lot:
import pandas as pd
from pyvis.network import Network
import itertools

THRESHOLD_NODES = 10000 # make sure that only tags that appear more than 10k times are shown
THRESHOLD_EDGES = 1000 # make sure that only edges with more than 1k connections are shown

df = pd.read_csv("./data/2024Q1_so.csv").dropna()


my_list = df["tags_delimited"].values
my_counts = df["cnt"].values
Create nodes:
nodes_dict = {}


for i in range(len(my_list)):
    my_count = my_counts[i]
    my_list_elements = my_list[i].split(",")

    for my_list_element in my_list_elements:
        nodes_dict[my_list_element] = nodes_dict.get(my_list_element, 0) + int(my_count)


nodes_dict_filtered = {}

for single_name, single_count in nodes_dict.items():
    if single_count >= THRESHOLD_NODES:
        nodes_dict_filtered[single_name] = single_count
Creates:
nodes_dict_filtered

>>> {'.htaccess': 50760,
 'apache': 47991,
 'caching': 12306,
 'codeigniter': 46641,
...
 'jakarta-ee': 11408,
 'django-forms': 16160,
}
Create edges:
edges_dict = {}

for i in range(len(my_list)):
    my_count = my_counts[i]
    my_list_elements = my_list[i].split(",")

    if len(my_list_elements) >= 2:
        pairs = list(itertools.combinations(my_list_elements, 2))

        for pair in pairs:
            if (
                pair[0] in nodes_dict_filtered.keys()
                and pair[1] in nodes_dict_filtered.keys()
            ):
                edges_dict[pair] = edges_dict.get(pair, 0) + int(my_count)


edges_dict_filtered = {}

for pair_name, pair_count in edges_dict.items():
    if pair_count >= THRESHOLD_EDGES:
        edges_dict_filtered[pair_name] = pair_count
Creates:
edges_dict_filtered

>>> {
 ('.htaccess', 'apache'): 18919,
 ('php', 'url'): 2766,
 ('.htaccess', 'wordpress'): 4130,
 ('java', 'regex'): 18845,
...
 ('css', 'typescript'): 1775,
 ('animation', 'javascript'): 5271,
}
We are ready to graph our network!
nt = Network(notebook=True, cdn_resources='in_line', height="800", select_menu=True)
nt.repulsion()

for node, size in nodes_dict_filtered.items():
    nt.add_node(node, value=size, gravity = size)

for edge, size in edges_dict_filtered.items():
    nt.add_edge(*edge, value=size)

nt.show_buttons(filter_=['physics'])
nt.show("so_graph.html");
BANG 💥
Let’s open so_graph.html – it would produce the interactive graph as presented below – it takes time to load like all of the good things in life.

Closing remarks
Thank you for visiting! If you’d like to explore further, please visit my git repository.
Stack Overflow also offers an insightful trends site if you’re curious about which tags (topics) are trending.
Please note, this exercise is an approximation. The Stack Overflow data API limits us to downloading 50k rows, so we needed to filter out less popular tags before aggregation. Additionally, the rendering of the graph may encounter issues with frontend browsers, so thresholds were introduced to enhance graph readability and mitigate potential frontend issues.
Happy coding!
Filip

